Introduction
For insulation board manufacturers and product engineers, two performance parameters govern whether a board will meet its thermal specification in real-world use: density and R-value. Density determines the physical structure and stability of the foam's closed-cell network, while R-value measures how effectively the finished board resists heat flow. Many manufacturers struggle to understand how these properties interact during production — small variations in mixing ratios or line speed can cause density drift that directly compromises the labelled R-value that building codes require and customers expect.
This article covers:
- How density and R-value are defined — and why they are linked
- How cell structure and blowing agent retention connect the two
- What drives variation in production and how to measure it
- What goes wrong when either parameter falls outside specification
Whether you are selecting board specifications for a project or optimising production quality control, this breakdown gives you the technical grounding to make informed decisions and catch problems before they reach the customer.
Key Takeaways
- R-value measures resistance to heat flow: higher values mean better insulation, but performance varies with temperature and degrades as blowing agents diffuse out over time
- Density does not directly predict R-value—it controls cell structure integrity and blowing agent retention, which in turn determine thermal conductivity
- In XPS, EPS, and polyiso boards, gas trapped in closed cells drives thermal resistance — density within specification keeps that cell structure intact
- R-values are tested under standard conditions (ASTM C518/C1289) and reported as long-term thermal resistance (LTTR) to account for aging
- Uniform thickness and consistent density across the board are the key production variables for achieving rated R-value reliably
What Density and R-Value Mean in Insulation Boards
R-value is the thermal resistance of a material, technically defined as the ratio of temperature difference across the material to heat flux per unit area. In imperial units, it is expressed as °F·ft²·h/BTU; the metric equivalent (RSI) is °C·m²/W. A higher R-value means slower heat transfer—not more heat absorbed. R-value describes resistance to heat flow, not the material's capacity to store thermal energy.
Density in insulation boards is mass per unit volume (kg/m³ or lb/ft³), determined by the ratio of solid polymer to gas-filled cell volume. For closed-cell foam boards like XPS, EPS, and polyiso, gas occupies 95% or more of total volume. This means the polymer matrix (cell walls and struts) represents less than 5% of total volume, making cell structure and the gas trapped inside the dominant variables governing thermal performance.
The relationship between density and R-value is indirect and non-linear. Density affects cell wall integrity, closed-cell ratio, and blowing agent concentration — all of which govern how effectively the board resists heat flow.
Density is a design parameter controlled during manufacturing; R-value is a derived characteristic measured from the finished board. You cannot calculate R-value from raw material properties alone — it must be measured under standardised test conditions that reflect real-world ageing and temperature exposure.
Factors That Influence Both Properties in Real-World Production
Board type and foam chemistry set the theoretical performance ceiling. Polyiso, XPS, and EPS have different polymer matrices and blowing agents, each with different intrinsic thermal conductivities. The table below shows approximate thermal conductivity values of common gases and blowing agents at 300K (~25°C):
| Gas / Blowing Agent | Thermal Conductivity (mW/m·K) | Application Context |
|---|---|---|
| Air | 26.4 | Baseline reference; replaces captive gases over time |
| Carbon Dioxide (CO₂) | 24.7 | XPS co-blowing agent / EPS expansion |
| n-Pentane | 39.9 | EPS and polyiso blowing agent |
| Isopentane | 42.3 | EPS and polyiso blowing agent |
| HFO-1233zd(E) | 10.8 | Polyiso and XPS low-GWP blowing agent |
| HFO-1234ze(E) | 13.6 | XPS low-GWP blowing agent |
Captive blowing agents like HFOs and pentane have significantly lower thermal conductivities than ambient air. As air diffuses into the foam over time, the overall thermal conductivity of the gas mixture increases, degrading the R-value.
Manufacturing process inputs (mixing ratios, line speed, curing temperature, and compression) determine the resulting density and cell uniformity. Small deviations in these inputs translate directly to density variation across the board:
- XPS uses die gap settings, blowing agent dosing, and cooling rates during continuous extrusion to set final density
- EPS reaches target density in the pre-expansion phase, controlled through steam temperature, pressure, and residence time before moulding
- Polyiso density is set during continuous lamination via MDI/polyol ratios, blowing agent charge, line speed, and nip pressure
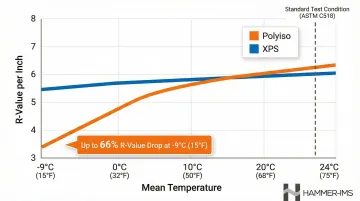
Temperature during end use also affects R-value. R-value is not fixed ; it changes with the mean temperature across the insulation layer. XPS performs differently at 4°C versus 24°C mean temperature, while polyiso shows greater sensitivity to cold conditions, with R-value dropping substantially below 4°C.
How Density and Board Structure Drive R-Value Performance
In closed-cell foam boards, thermal conduction through cell gas dominates heat transfer. The polymer matrix (cell walls and struts) accounts for a small fraction of total volume and contributes minimally to total conductivity.
Research breaks down heat transfer across three mechanisms:
- Gas conduction: ~50–60% of total thermal conductivity
- Radiation: ~34%
- Solid conduction through the polymer: ~16%
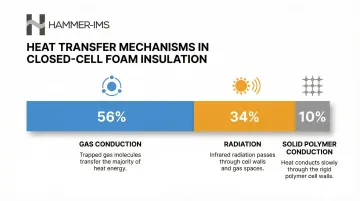
Convection within cells is negligible due to small cell size. Numerical studies confirm that gas convection is effectively inhibited at pore sizes below 6.1 mm.
The Density-Cell Structure Relationship
As density decreases below the optimal range, cell walls thin, closed-cell integrity can degrade, and blowing agent is less well-retained. This directly undermines long-term thermal resistance: boards with lower density experience accelerated aging as blowing agents escape more readily, causing R-value to decline faster over time than properly densified boards.
Thickness Multiplier and Uniformity
R-value is cumulative and approximately linear with thickness for a given material—doubling thickness roughly doubles R-value. However, this relationship assumes uniform density throughout the board cross-section. When density varies through thickness (for example, due to uneven cooling or inconsistent mixing), the linearity breaks down. Localised thin or low-density zones create thermal weak points even if the average thickness is correct.
Long-Term Thermal Resistance (LTTR)
Thickness and density uniformity matter at the point of manufacture — but R-value performance also shifts over the product's lifetime. As blowing agents gradually diffuse out of cells, ambient air diffuses in. Since air has higher thermal conductivity than blowing agents such as pentane or HFOs, the board's R-value decreases over time. LTTR values are designed to represent a 15-year time-weighted average, specifically estimating thermal resistance at an effective age of 5 years. The LTTR method (ASTM C1303 and CAN/ULC-S770) uses "slicing and scaling" to accelerate the aging process, accounting for the physical reality of gas diffusion.
Role of Facers
Facers—foil, fibre-reinforced, or glass mat layers—protect cell structure and stabilise density at the board surface. Facer type affects both moisture resistance and long-term R-value retention, especially in roof and below-grade applications where moisture exposure and mechanical stress are highest.
R-Value Ratings and Ranges by Insulation Board Type
R-value per inch varies by foam chemistry and density class. The table below shows approximate R-value per inch for common insulation board types at the standard 75°F (24°C) mean test temperature:
| ASTM C578 Type | Material | Minimum Density (lb/ft³) | Compressive Strength (psi) | Minimum R-Value per Inch (75°F) |
|---|---|---|---|---|
| Type I | EPS | 0.90 | 10.0 | R-3.6 |
| Type VIII | EPS | 1.15 | 13.0 | R-3.8 |
| Type II | EPS | 1.35 | 15.0 | R-4.0 |
| Type IX | EPS | 1.80 | 25.0 | R-4.2 |
| Type X | XPS | 1.30 | 15.0 | R-5.0 |
| Type IV | XPS | 1.55 | 25.0 | R-5.0 |
| Type VI | XPS | 1.80 | 40.0 | R-5.0 |
| Type VII | XPS | 2.20 | 60.0 | R-5.0 |
| Type V | XPS | 3.00 | 100.0 | R-5.0 |
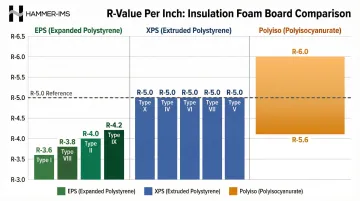
Polyiso provides the highest R-value per inch of the three foam board categories, ranging from R-5.6 to R-6.0 per inch (LTTR at 75°F).
ASTM C578 Density Classification for XPS
ASTM C578 defines six primary density types for XPS, differentiated by compressive strength and density. All types except Types XII and XIII deliver the same thermal performance per inch (R-5.0), so density type selection is driven by compressive load requirements rather than R-value.
Application examples by load demand:
- Type X (15 psi) — standard wall sheathing and above-grade applications
- Type V (100 psi) — high-load applications such as under-slab and plaza deck installations
Total Installed R-Value and Code Compliance
Total installed R-value is the product of R-value per inch and board thickness. Manufacturers publish thickness-to-R-value charts for each product. Building codes specify minimum R-values by climate zone and application (roof, wall, below grade), so verifying the correct board specification against the applicable IECC climate zone table is a required step, not an optional one.
How R-Value Is Specified, Measured, and Validated
R-value functions as both a design specification (confirmed at the point of product development) and an ongoing production quality parameter (verified through in-process and finished-product measurement). Both perspectives matter for insulation board manufacturers.
Specification and Standards
Key standards governing R-value specification include:
- ASTM C1289: Specifies LTTR values for polyiso at 75°F mean temperature and requires 40°F and 110°F values to be available on request
- ASTM C578: Classifies XPS and EPS by density type with associated minimum R-values
- ISO 8302 and ISO 6946: Define the guarded hot plate method and calculation methods for thermal resistance of building components—metric-system equivalents of ASTM standards widely used in North American markets
Published label values are legally enforceable under the FTC R-Value Rule (16 CFR Part 460) for residential applications. The FTC requires manufacturers to base R-value claims on specific ASTM test methods conducted at a 75°F mean temperature. For closed-cell foams, tests must be performed on samples that fully reflect the effect of aging.
PIMA QualityMark™ Programme
The PIMA QualityMark programme is a voluntary third-party certification mechanism that independently validates LTTR values for polyiso. Annual verification involves third-party testing of production samples to confirm that labelled values are met in commercial production. 2015 data showed average 1-inch boards testing at R-5.78, exceeding the published R-5.7 baseline.
Measurement and Verification Methods
The guarded hot plate and heat flow meter (ASTM C518) are the primary lab test methods. Each measures heat flow through a sample under steady-state conditions. The reported R-value is an average across a temperature range, not a single-point measurement—often misread as a single-point result.
In production, R-value is controlled indirectly through thickness and density measurement — direct thermal resistance testing cannot be performed inline at production speeds. Inline thickness gauging ensures boards meet the dimensional specifications that correspond to their rated R-value.
Density uniformity across the board cross-section matters just as much. Localised thin or low-density zones create thermal weak points even when average thickness is correct.
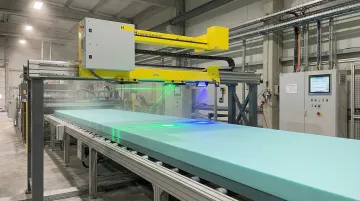
Inline monitoring systems address this directly. Hammer-IMS M-Ray systems provide non-nuclear, contactless measurement of insulation board thickness and density uniformity during continuous production. Real-time data feeds back to process controls to reduce thickness margins, minimise material overuse, and flag density deviations before boards leave the line — supporting consistent R-value delivery across high-volume production.
The practical impact is measurable. Abriso-Jiffy, a West Flanders XPS manufacturer producing over 200,000 cubic metres of insulation boards annually, implemented a Hammer-IMS inline quality monitoring system that paid for itself within the first year and a half through waste reduction and consistent quality.
Consequences of Density and Thickness Deviations from Specification
A board with density below its specified range will have a lower closed-cell ratio and reduced blowing agent retention, resulting in a measured R-value that falls below the labelled value. This gap widens over time because the LTTR decay curve is steeper for lower-density boards.
Studies show that aging induces thermal resistance losses of:
- 10% to 23.8% in XPS over the product lifecycle
- 23% to 26% in polyiso over the product lifecycle
Both rates accelerate when density is compromised from the outset.
Structural and Durability Failures
Under-dense boards have lower compressive strength, making them susceptible to deformation under load, particularly in roof and under-slab applications. Deformation under load compresses the board, permanently reducing thickness and therefore installed R-value. Because R-value is directly proportional to thickness, any physical compression results in a permanent performance loss.
Compliance and Liability Implications
Boards that do not meet labelled R-values may create code compliance failures, expose manufacturers to liability under the FTC R-Value Rule, and trigger warranty claims. The FTC actively enforces the R-Value Rule to prevent deceptive marketing—civil penalties have reached $350,000 for deceptive insulation claims. Third-party audits (such as PIMA QualityMark) and documented production quality records are the primary mechanisms for demonstrating conformance.
Common Misinterpretations of Density and R-Value in Practice
Higher density does not always mean higher R-value. Above an optimal density range, increasing polymer content raises solid-phase conduction and adds weight without improving—and potentially degrading—thermal resistance per unit thickness. Research shows that foam density is an optimised trade-off between radiation and solid conduction. Beyond an optimal point (approximately 40 kg/m³ for certain polyurethane formulations), the increase in solid-phase conduction outpaces the reduction in radiation, causing overall thermal conductivity to rise and R-value to drop.
Climate-Adjusted R-Values
Lab-measured R-values should not be applied directly to all climate conditions without temperature adjustment. The mean temperature across the insulation layer in cold climates can differ significantly from the 75°F (24°C) standard test condition, meaning real-world performance may fall short of the labelled figure.
The effect can be substantial. Polyiso's R-value can drop 66% at a 15°F (-9°C) mean temperature. Building energy modelling for compliance with standards like ASHRAE 90.1 or IECC (US standards) should use climate-adjusted, temperature-dependent R-values to accurately predict winter heat loss.
LTTR vs. Initial R-Value Confusion
Some designers compare initial (unconditioned) R-value of one product against the LTTR of another, producing misleading comparisons. LTTR is the specification-compliant basis for comparison, representing a 15-year time-weighted average. Initial values should not be used for building energy modelling or code compliance calculations.
Conclusion
Density and R-value are interdependent parameters that must be understood together. Density governs cell structure and blowing agent retention — both of which determine thermal conductivity. R-value is the measurable outcome that follows from density, thickness, material chemistry, and temperature combined.
For insulation board manufacturers, that relationship has a direct production implication. Maintaining consistent density and thickness across a production run is the mechanism through which labelled R-values are actually achieved.
That makes process measurement a quality assurance function, not a secondary one. Accurate, real-time thickness and density monitoring ties directly to product performance, regulatory compliance, and the reliability of every R-value claim on a product label.
Frequently Asked Questions
How to measure thermal insulation?
Thermal insulation is measured using the guarded hot plate or heat flow meter methods (ASTM C518), which determine R-value under steady-state conditions. In production environments, insulation board performance is controlled indirectly through inline thickness and density measurement.
What is ISO in insulation?
ISO refers to the International Organisation for Standardisation, which publishes standards such as ISO 8302 (guarded hot plate method) and ISO 6946 for calculating thermal resistance of building components. Both are metric-system equivalents of the ASTM standards widely used in North American markets.
Does higher density always mean higher R-value in foam insulation boards?
Density and R-value are related but not directly proportional. Within the optimal production range, adequate density ensures cell integrity and blowing agent retention. However, exceeding that range increases solid polymer conduction without improving thermal resistance and can actually reduce R-value per inch.
What is LTTR in insulation?
Long-Term Thermal Resistance (LTTR) is a standardised estimate of a foam board's R-value based on a 15-year time-weighted average, reported at the 5-year mark. It accounts for gradual R-value loss as blowing agents diffuse out of cells over time.
How does temperature affect insulation board R-value?
R-value is measured at a specified mean temperature and changes with actual operating conditions. XPS performs slightly better at lower temperatures, while polyiso is more sensitive to cold and may deliver lower effective R-value in colder climates than its label value indicates at 75°F.
What is the HS code for insulation board?
Insulation boards are classified under HS Chapter 39 (plastics) or Chapter 68 (articles of stone, plaster, cement) depending on material — for example, XPS and EPS typically fall under HS 3921, while mineral wool boards fall under 6806. Always verify with your customs authority, as classifications vary by jurisdiction.