Introduction: Why Battery Film Quality Demands Microscopic Precision
Lithium-ion battery demand skyrocketed to 850 GWh in 2023 and is forecast to surge past 3 TWh by 2030. Yet as production ramps, manufacturers face a hidden enemy: electrode scrap rates ranging from 15% to 30% during early production, and lingering around 10% even after five years of operation. The culprit? Microscopic defects—uneven coatings, internal voids, micro-cracks—lurking within films thinner than a human hair.
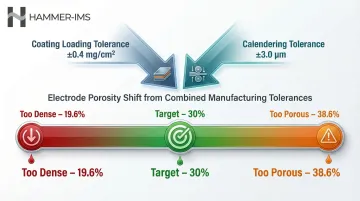
Battery performance is determined at the micron scale. Electrode coatings measure just 50 to 200 µm thick; separator films span 5 to 25 µm. Even a ±3 µm calendering deviation can swing electrode porosity from a target 30% to anywhere between 19.6% and 38.6%, wrecking energy density and cycle life.
The failure modes compound quickly. Sub-surface cracks invisible to optical inspection trigger capacity fade. Non-uniform coatings create local current density hotspots, accelerating lithium plating under fast-charge conditions.
This article explores what X-ray microscopy reveals about battery film microstructure, how those lab insights translate into production quality challenges, and which inline measurement technologies help manufacturers close the gap between research and real-time quality control.
TLDR:
- X-ray microscopy visualizes porosity, tortuosity, and particle packing inside electrode films
- Lab findings establish critical specifications for coating thickness and basis weight
- High scrap rates (15-30% early production, ~10% stable runs) threaten margins
- Inline systems like Marveloc-CURTAIN-MINI enforce XRM-derived quality thresholds at production speed
- Combined thickness and defect detection bridges the gap from nanoscale science to web-speed manufacturing
What Are Battery Films? A Quick Overview
Battery films fall into two categories: electrode films and separator films. Electrode films consist of active material coatings (cathode or anode) applied to metal current collectors—copper foil for anodes, aluminium foil for cathodes. Separator films are porous membranes that physically isolate anode and cathode while permitting ion transport.
Separator Film Composition
Battery separators are predominantly made from polyolefin polymers:
- Polyethylene (PE) – provides thermal shutdown at ~135°C
- Polypropylene (PP) – offers high-temperature stability and oxidation resistance
- Trilayer PE/PP/PE – combines PE shutdown with PP structural integrity
To improve thermal stability and electrolyte wettability, manufacturers apply ceramic coatings:
- Alumina (Al₂O₃) – reduces shrinkage from 6.0% (uncoated) to 0.6% at 130°C
- Silica (SiO₂) – improves contact angle to 19.8°
- Boehmite (AlOOH) – achieves just 1–3% shrinkage at 150°C versus >70% for uncoated PE
Commercial separators typically range from 5 to 25 µm thick, with 16–20 µm capturing 44.7% of the 2025 market.
Both separator and electrode films share a common challenge: small structural deviations produce outsized performance losses. For electrode films specifically, three parameters are most sensitive:
Why Film Properties Are Performance-Critical
Electrode film parameters directly govern cell performance:
- Coating thickness – affects energy density and charge/discharge rate
- Active material loading (basis weight) – determines areal capacity
- Porosity – controls electrolyte wetting and ion diffusion speed
Even small deviations propagate into measurable losses. A coating loading tolerance of just ±0.4 mg/cm² combined with a ±3.0 µm calendering tolerance causes a 30% target porosity to shift from 19.6% to 38.6%.
That variance ripples through electrolyte volume requirements, rate performance, and negative-to-positive capacity ratio—creating cell-to-cell variation that complicates battery management systems and reduces pack-level performance.
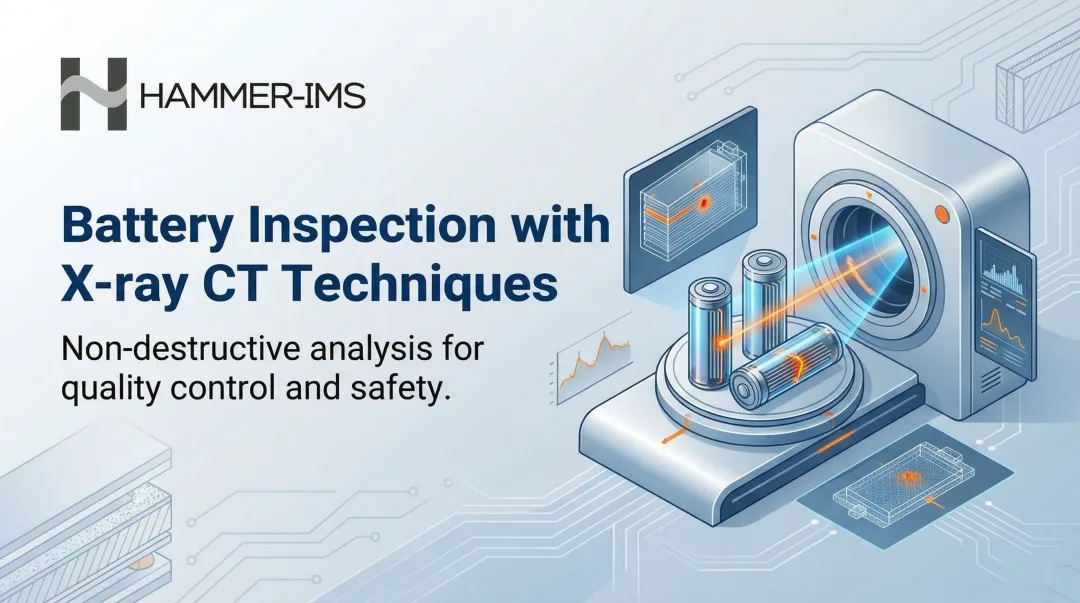
X-ray Microscopy as a Research Tool for Battery Films
X-ray microscopy (XRM) and X-ray computed tomography (nano-CT/micro-CT) use X-ray transmission to reconstruct 2D cross-sections or full 3D volumes of a sample's internal structure without physical cutting. Lab-based nano-CT achieves resolutions as low as 50 nm, allowing non-destructive extraction of critical parameters invisible to surface inspection.
What X-ray Microscopy Can Visualize Inside Electrode Films
XRM reveals two categories of electrode microstructure that directly affect cell performance:
- Pore network and tortuosity: XRM maps the interconnected pore architecture within electrode coatings, which controls how electrolyte wets the electrode and how lithium ions diffuse through the active material layer. Studies show tortuosity increases significantly over the first 30 µm from the separator, exposing inhomogeneous microstructure that surface inspection cannot detect.
- Particle distribution and packing density: XRM maps particle size and spatial packing density throughout coating thickness, identifying whether particles are uniformly dispersed or segregated. Heterogeneous packing creates uneven current densities, accelerating lithium plating or electrolyte decomposition in high-density regions.
Detecting Structural Changes from Electrode Calendering
Calendering—the roll-pressing step used to densify electrode coatings after drying—significantly alters porosity and particle morphology. In-situ X-ray nano-CT tracking incremental calendering steps shows that active particles undergo re-arrangement, deformation, and fracture. At 150 MPa pressure, particles exhibit obvious cracks.
XRM applied before and after calendering quantifies densification degree, identifies crushed or cracked particles, and reveals delamination between the coating and current collector foil.
Limitations of Lab-Scale X-ray Microscopy
While XRM provides sub-micron structural detail, it remains fundamentally a laboratory technique:
- Sample preparation is required
- Scan times range from minutes to hours
- Field of view is limited to small coupons
- Unsuitable as a standalone quality control tool for high-speed production lines
These constraints define a clear gap: XRM establishes what optimal electrode microstructure looks like at the nanoscale, but production lines run at speeds where sample-by-sample inspection is impossible. Bridging that gap requires inline measurement approaches that can track coating uniformity in real time.
Key Microstructural Insights That Drive Quality Standards
Porosity Targets
XRM studies have established that calendered electrode porosity must fall within specific ranges: typically 30-40% for cathodes and 35-45% for anodes. Deviating in either direction carries a cost:
- Too dense limits ion transport pathways, reducing rate capability
- Too porous reduces active material loading, cutting volumetric energy density
Coating Thickness Non-Uniformity
X-ray microscopy reveals that coating thickness non-uniformity at the microscale—even within samples that appear uniform macroscopically—creates localized current density variations. High-speed X-ray diffraction during 6C fast charging showed that lithium plating onset occurs exclusively within the first 15 µm from the separator due to depth-wise microstructural heterogeneity.
Sub-Surface Cracking
Sub-surface cracking, invisible to optical inspection, is detectable via XRM and correlates with capacity fade over charge cycles. This insight has driven stricter calendering pressure controls and coating formulation adjustments across the industry.
Tortuosity as a Design Parameter
Beyond detecting defects, XRM also informs how electrodes are designed. Tortuosity (τ) quantifies the actual path length ions must travel through the pore network versus straight-line distance — higher values mean longer, more convoluted pathways and reduced effective ionic conductivity.
XRM-derived tortuosity data now serves as a direct design parameter, linking microstructure to rate performance. Manufacturers target lower tortuosity through optimized particle size distributions and controlled calendering parameters.
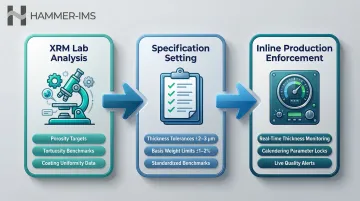
Establishing Ground Truth Specifications
XRM findings establish "ground truth" specifications for thickness, basis weight, and coating uniformity that translate directly into production control targets. In practice, this means:
- Inline thickness gauges monitor coating uniformity against XRM-derived tolerances
- Basis weight limits flag deviations before they reach cell assembly
- Calendering parameters are locked to porosity and tortuosity benchmarks confirmed at the lab stage
From Lab Insights to Production: Quality Control Challenges
The fundamental challenge: X-ray microscopy generates micro-to-nanoscale knowledge about ideal electrode structure, but battery film production lines run at speeds where individual sample inspection is impossible. This creates a gap between R&D understanding and real-time quality assurance.
Key Parameters That Must Be Monitored in Production
Critical measurable parameters for inline quality control that directly reflect XRM-established benchmarks:
- Coating thickness (wet and post-calendering) – typically maintained within ±2 to 3 µm
- Active material basis weight (areal loading) – uniformity targets have tightened from ±5% to ±1-2%
- Cross-web uniformity – consistency across full web width is as important as hitting the average target
Production Defect Classes
Defects that undermine XRM-defined quality standards include:
- Pinholes – create short-circuit potential
- Coating streaks – indicate uneven material distribution
- Edge thinning – reduces effective active area
- Calendering-induced cracks – accelerate capacity fade
- Delamination – separates coating from current collector, creating dead zones
Any of these defects left undetected in production directly feeds into the cost problem explored below.
The Cost of Undetected Deviations
Any of these deviations escaping detection translate into cell-to-cell performance variation within battery packs. This complicates battery management system (BMS) calibration, reduces pack-level energy delivery, and in worst cases creates thermal runaway risk.
The material losses compound quickly. During stable wet coating processes, scrap rates average around 5%, and approximately 5.76 kg of active material becomes unusable from just 30 seconds of incorrectly coated electrode.
Inline Measurement Solutions for Battery Film Production
Inline, non-contact measurement systems translate XRM-derived quality specifications into enforceable production controls—enabling continuous, full-width monitoring at production speed rather than post-process sampling.
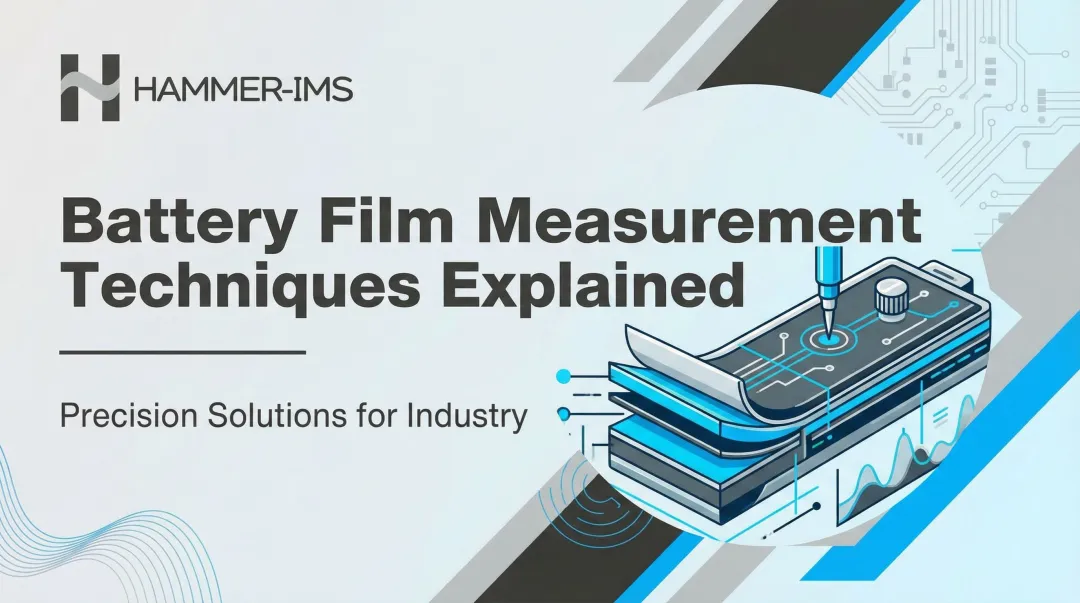
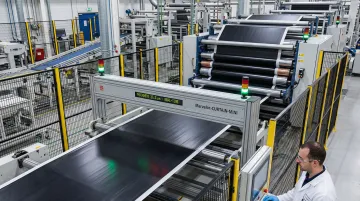
Marveloc-CURTAIN-MINI for Electrode Coating and Calendering
Hammer-IMS's Marveloc-CURTAIN-MINI uses U-Ray and L-Ray sensor technology to deliver contactless thickness and basis weight measurements at the two stages where XRM research shows quality is most critically determined:
- Electrode coating stage — monitors coating weight uniformity across the full web width
- Post-calendering stage — verifies compressed electrode density meets specification
- Non-nuclear, non-radioactive design — eliminates the regulatory compliance burdens tied to radioactive measurement technologies
Real-time measurement data feeds back into the production process, enabling closed-loop adjustment capability. Operators can correct coating weight or calendering pressure deviations before they affect significant web lengths—directly translating XRM-identified quality thresholds into production-level enforcement.
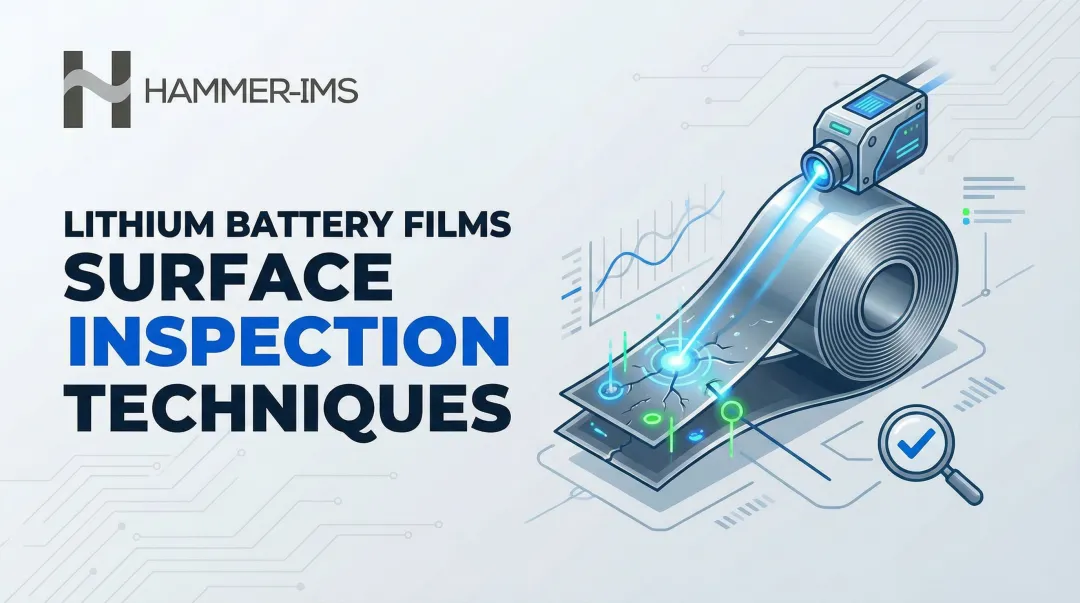
Defect Detection with Edge-Vision-4.0
Hammer-IMS's Edge-Vision-4.0 system complements thickness and basis weight measurement by detecting coating defects, cracks, and surface anomalies in real time using 4K multi-camera technology. The system detects defects at 50 micrometres and below—providing the surface-level defect visibility that X-ray microscopy provides only in lab settings. The system flags and traces anomalies before cell assembly, preventing defective material from entering downstream production.
Combined, these two systems give manufacturers a continuous quality enforcement layer across coating weight, electrode density, and surface integrity—so defects identified in XRM research never reach finished cells.
Frequently Asked Questions
What is battery separator film made of?
Battery separator films are typically made from polyolefin polymers—polyethylene (PE), polypropylene (PP), or trilayer PE/PP/PE structures. Ceramic coatings (alumina, silica) are often added to improve thermal stability and electrolyte wettability, reducing shrinkage and enhancing safety.
What does X-ray microscopy reveal about battery electrode structure?
XRM reveals internal porosity distribution, active material particle arrangement, tortuosity of ion pathways, and structural changes caused by calendering—information invisible to surface inspection.
What is the typical thickness of a battery electrode film?
Electrode coating thickness varies by chemistry and application. NMC cathodes typically range from 48 to 154 µm (single-side, post-calendering) with areal loadings of 12.5 to 37.6 mg/cm². Graphite anodes range from 58 to 182 µm with loadings of 7.3 to 23.4 mg/cm². High-energy LFP cathodes can reach 220 µm.
How does coating uniformity affect battery cell performance?
Non-uniform coating creates localized current density variations, which accelerate degradation in high-current-density regions. This increases capacity fade rate and creates thermal hotspots under fast-charge conditions—even micron-level thickness deviations produce measurable performance losses.
What types of defects occur in battery electrode coatings?
Common defect types—and their primary risks—include:
- Pinholes: short-circuit risk
- Streaks: uneven active material distribution
- Edge thinning: reduced active area
- Calendering-induced cracks: accelerated capacity fade
- Delamination from current collector: creates electrically dead zones