Introduction
Manufacturing lines don't wait for inspectors. Film extrusion lines run at 700 m/min, nonwoven production reaches 1,200 m/min, and textile weaving operates at comparable speeds — yet defects can propagate for extended periods before manual inspectors catch them.
During that window, manufacturers produce hundreds or thousands of meters of off-specification material. Scrap rates typically range from 2–5% and can spike to 15% in conversion processes.
Industrial anomaly detection systems address this challenge by automatically identifying deviations from established process or product norms in real time. Rather than relying on periodic sampling that covers only a fraction of output, these systems shift quality control from reactive to predictive — catching problems within seconds and enabling correction before significant waste accumulates.
Key Takeaways
- Detects deviations in thickness, density, coating weight, and temperature before they result in out-of-spec product
- Three core types: point anomalies (sudden defects), contextual anomalies (condition-dependent deviations), and drift anomalies (slow process degradation)
- Pairs continuous sensor measurement with rule-based and ML algorithms to trigger real-time alerts
- Closed-loop systems automatically adjust process parameters when anomalies occur, minimizing waste
- Used across textiles, plastics, steel, and medical devices to reduce scrap and tighten production tolerances
What Is Anomaly Detection in Industrial Process Monitoring?
Industrial anomaly detection is the automated identification of deviations in physical, chemical, or mechanical process parameters that differ significantly from established normal behaviour. Unlike cybersecurity or financial anomaly detection, industrial systems focus on tangible manufacturing parameters:
- Thickness variations in extruded film
- Density fluctuations in nonwoven webs
- Coating weight deviations on steel strip
- Temperature drift in processing equipment
The scale problem makes automation essential. Modern production lines operate continuously at speeds where human inspectors miss 20-30% of defects, with detection variability ranging between 60-90% due to fatigue and attention limits. At 700 metres per minute, a film extrusion line produces over 40 kilometres of material per hour—far more than manual sampling can verify.
Traditional approaches relied on periodic physical checks and lab measurements that examined small samples hours after production. Modern inline systems have moved quality control from the lab to the production line itself.
Sensors positioned directly on the line generate continuous data streams, enabling statistical and algorithmic detection of problems as they emerge—before hundreds of metres of defective material have already run through.
Types of Anomalies Found in Manufacturing Processes
Point Anomalies: Sudden, Isolated Deviations
Point anomalies appear as single, isolated deviations at a specific measurement point. Examples include:
- An abrupt thin spot in plastic film caused by momentary die obstruction
- A localized density drop in a nonwoven web from fiber clumping
- A sudden temperature spike from equipment malfunction
- Individual thickness measurements that fall outside specification limits
Point anomalies are the easiest to detect with fixed threshold alarms. When a single measurement exceeds ±3 standard deviations from the mean, most systems trigger an immediate alert.
Contextual Anomalies: Location or Timing Dependent
Contextual anomalies appear normal globally but are abnormal in their specific context:
- A thickness value within overall specification limits but occurring at the product center rather than the expected edge taper
- A temperature reading normal during summer startup but anomalous mid-run in winter
- Density measurements acceptable for one product grade but out-of-spec for another grade running on the same line
- Coating weights appropriate for one substrate but incorrect when applied to a different material
These require contextual awareness—the system must know not just the measurement value but where, when, and under what conditions it was taken.
Sequential and Drift Anomalies: Gradual Process Degradation
Sequential anomalies emerge when no single measurement triggers an alarm, but the overall trend signals a process moving out of control. Common causes include:
- Die wear in extrusion: Gradual degradation causes automatic gauge control in extrusion too subtle for threshold alarms until product is out-of-spec
- Coating weight drift: Process parameters shift gradually, leading to under-coating (corrosion risk) or over-coating (material waste)
- Raw material batch variation: Slight differences in feedstock properties accumulate over time
- Machine degradation: Bearing wear, belt stretching, or calibration drift that develops over days or weeks
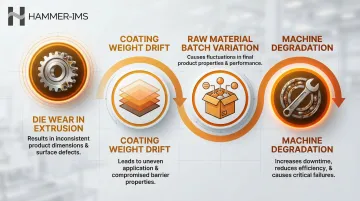
These require trend analysis, Statistical Process Control (SPC) charting, or time-series algorithms rather than simple threshold checking.
Product Quality vs. Equipment Health Anomalies
Distinguishing between these two categories determines the right response:
Product quality anomalies are defects measurable in the output:
- Holes, lumps, or coating voids in the finished product
- Density non-uniformity across web width
- Thickness variations exceeding specification
- Surface defects or contamination
Equipment anomalies reflect abnormal machine behavior that predicts upcoming quality problems:
- Vibration increases signaling bearing wear
- Speed fluctuations indicating drive system issues
- Temperature drift suggesting heating element degradation
- Pressure variations warning of pump or valve problems
The goal is to catch equipment anomalies before they affect product quality — enabling predictive maintenance that prevents defective production rather than reacting to it.
How Industrial Anomaly Detection Systems Work
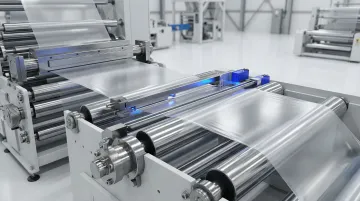
Data Acquisition: Continuous Sensor Measurement
The foundation is high-frequency measurement across the full production width. Sensors—contact or non-contact—measure parameters such as:
- Thickness and gauge: Laser, electromagnetic, or ultrasonic sensors
- Mass per unit area (GSM/basis weight): Electromagnetic or beta backscatter gauges
- Coating weight: X-ray fluorescence or electromagnetic sensors
- Surface profile and defects: Vision systems and laser profilometers
- Temperature: Infrared cameras and thermocouples
Non-contact measurement is preferred in continuous processes because it avoids product disturbance and enables full-width scanning. Hammer-IMS's M-Ray technology uses electromagnetic millimeter waves to measure thickness and basis weight without touching the material, maintaining accuracy even on hot, freshly extruded products at temperatures exceeding 100°C.
Baseline Establishment: Defining "Normal"
Systems must first learn what "normal" looks like for each product grade and process condition. This baseline establishment uses:
- Historical production data from previous runs of the same grade
- A defined commissioning period where known-good product is measured
- Statistical characterization (mean, standard deviation, control limits)
- Multi-grade profiles stored as recipes for different products
The quality of this baseline directly determines sensitivity and false-alarm rate. A poorly established baseline leads to either missed defects (too loose) or alarm fatigue (too sensitive).
Detection Methods: Statistical and Machine Learning Approaches
Statistical Process Control (SPC) remains the standard for well-understood processes:
- Shewhart control charts: Detect large, sudden shifts using ±3σ limits
- CUSUM and EWMA charts: More sensitive to small shifts and gradual drift by incorporating historical data
- Z-score thresholds: Flag measurements exceeding defined statistical boundaries
Machine Learning (ML) excels at complex, multivariate patterns:
- Autoencoders: Learn normal patterns and flag reconstructions that differ significantly
- Isolation Forests: Identify anomalies by isolating unusual data points
- LSTM networks: Detect sequential anomalies in time-series data
Research shows hybrid approaches outperform single-method systems. In automotive stamping, a CNN-LSTM model achieved 96% accuracy in scrap prediction, detecting impending out-of-control conditions approximately 0.5 seconds before conventional SPC triggers. An EWMA chart monitoring Isolation Forest anomaly scores achieved 79.8% True Positive Rate with 0% False Positives in wind turbine bearing monitoring.

Real-Time vs. Batch Analysis
Real-time analysis detects anomalies during production:
- Enables immediate corrective action
- Minimizes length of defective material produced
- Supports closed-loop feedback to process actuators
- Critical for high-speed continuous manufacturing
Batch/post-run analysis serves different purposes:
- Root cause investigation of recurring problems
- Trend reporting for process improvement
- Model retraining and baseline updates
- Quality documentation and compliance records
Most modern systems support both modes. Hammer-IMS's Connectivity 3.0 platform provides real-time monitoring with immediate alerts while simultaneously logging all measurement data for historical analysis and trend visualization.
Alert and Response Mechanisms
Response mechanisms range from simple notification to full automation:
Basic alerts:
- Visual or audible alarms at operator stations
- Dashboard displays highlighting out-of-spec areas
- Email or SMS notifications to supervisors
Automated tracking:
- Flagging of suspect production rolls or sheets for inspection
- Automatic quality grading (A, B, reject)
- Traceability records linking defects to production conditions
Closed-loop feedback:
- Automatic die gap correction in film extrusion
- Speed adjustments to maintain thickness targets
- Raw material feed rate changes
- Coating blade height and angle adjustment
Closed-loop systems generate the greatest return by correcting problems within seconds—before significant waste accumulates.
Industrial Applications: Which Sectors Benefit Most
Textile and Nonwovens Manufacturing
Continuous monitoring of mass per unit area (GSM), thickness uniformity, and fiber orientation prevents delivery of non-conforming material. Anomalies such as thin streaks, dense bands, or contamination spots are detected in real time across full web width.
The industry trend toward lighter materials—EDANA reports average basis weights of 34.9 gsm in 2024—makes uniformity control even more critical. Hygiene applications demand 8-10 gsm fabrics with minimal variation.
Reducing scrap from 4% to 1.5% on an 8,000 ton/year line saves €240,000 annually. Multi-head M-Ray systems provide high-coverage, non-contact basis weight measurement even on thick nonwovens, enabling early feedback before bonding stages.
Plastic Film, Sheet, and Foam Production
Thickness and gauge variation detection is critical for packaging performance, optical properties, and material cost control. Uncontrolled lines can see thickness variation exceeding 5%; inline gauging with process optimisation reduces this to less than 1%.
Reducing average thickness by just 2% on a 450 kg/hr line saves €900 per week in resin — a 5% reduction yields €2,250 weekly. Over-gauging by just 5 microns on a 1-metre-wide web can cost over €50,000 annually.
Closed-loop control systems use thermal bolts that expand to narrow the die lip locally, automatically correcting thickness profiles. Hammer-IMS systems combine M-Ray non-contact measurement with closed-loop feedback, enabling real-time process correction that reduces material waste and maintains tighter specifications.
Steel Strip, Metal, and Coatings Processing
Coating weight monitoring—galvanising, paint, lacquer—and strip thickness measurement detect anomalies affecting corrosion resistance, mechanical properties, and downstream processing. Full-width scanning identifies edge anomalies and cross-directional profiles deviating from target.
Key standards define the acceptable range — and the cost of missing it:
- ASTM A653 G90: requires 0.90 oz/ft² total coating weight (both sides)
- EN 10346 Z275: mandates 275 g/m² minimum for structural steels
- Under-coating risks corrosion claims; over-coating wastes zinc
Continuous monitoring uses X-ray fluorescence and beta backscatter for inline coating weight, with magnetic flux gauges for general surveys.
Medical Device and Specialty Materials Manufacturing
Strict dimensional tolerances and material homogeneity requirements require traceable inline measurement data for every production lot. The FDA's Quality Management System Regulation (QMSR), effective February 2, 2026, incorporates ISO 13485:2016 by reference, aligning US requirements with global standards emphasising process validation and monitoring.
Continuous inline measurement replaces or supplements destructive offline sampling, providing a complete audit trail of production conformance. Orfit Industries, a medical device manufacturer, implemented Hammer-IMS's M-Ray system to measure hot thermoplastic sheets immediately after extrusion, enabling prompt adjustment of extrusion parameters to maintain correct thickness and avoid wasting tons of high-grade material.
From Sensor to Response: Implementing Anomaly Detection in Production
Non-Contact Sensing: Safety and Regulatory Advantages
The market for non-contact film thickness measurement is projected to grow from €470 million in 2025 to €705 million by 2033, driven by precision requirements and safety concerns. Optical technologies (laser, spectroscopic) dominate with approximately 60% market share due to their precision and non-destructive nature.
Non-nuclear gauges eliminate the severe regulatory burdens of radioactive source licensing, disposal, and specialized safety training. They remove radiation exposure risk, simplifying safety protocols and reducing liability. In cleanroom, medical device, and food-grade environments, this is particularly valuable—avoiding contamination risks and complex compliance requirements.
Closed-Loop Integration: From Detection to Correction
The highest value comes when detection connects directly to process control systems. When a thickness anomaly is flagged, an automatic adjustment signal is sent to the relevant actuator—die bolt, press, coating head—within seconds, reducing the length of defective material produced.
Hammer-IMS systems support closed-loop feedback across multiple control architectures:
- 24V PWM signaling to power electronics modules for individual die bolt control
- Field-bus outputs for die adjustment robots across extrusion lines
- Dual PI-controller loop for coating applications, adjusting blade height and angle simultaneously with high time resolution for dynamic production environments
Data Management and Remote Monitoring
Modern systems log all measurement data continuously, enabling post-run analysis, trend reporting, and remote access for process engineers across multiple lines or sites.
Hammer-IMS's Connectivity 3.0 platform covers the full data management stack:
- Database integration: Microsoft SQL and FTP/SFTP servers, with optional Grafana dashboards for historical analysis
- Industrial protocols: Modbus TCP/IP, OPC UA, and PROFINET for direct integration with existing MES and plant control infrastructure
- Remote access: TeamViewer or VNC-VPN connections for rapid service response, predictive maintenance, and firmware upgrades
Key Benefits and Common Implementation Challenges
Primary Business Benefits
Reduced material waste: Fewer meters of off-spec product produced before correction. Normal scrap rates of 2-5% can be significantly reduced through real-time detection and correction.
Lower customer complaint rates: Consistent quality reduces returns and strengthens customer relationships.
Reduced inspection labor: Automated monitoring replaces manual sampling, freeing personnel for higher-value tasks.
Improved process understanding: Continuous data capture reveals patterns invisible to periodic sampling, enabling optimization.
ROI for web gauging systems is often achieved within 6-8 months through material savings alone.
Common Implementation Challenges
Baseline establishment: Defining "normal" in dynamic environments with many product grades requires rigorous data collection. A poorly established baseline leads to either missed defects or alarm fatigue.
Threshold calibration: Balancing sensitivity against false alarms is critical. Too sensitive creates alarm fatigue; too loose misses defects. Calibration must account for process noise and data autocorrelation inherent in high-speed continuous processes.
Integration complexity: Success depends on reliable integration with PLC, SCADA, and MES layers. Data silos prevent the real-time feedback loops necessary for automated correction.
Operator buy-in: Ensuring operators trust alerts and take correct action requires training and validation. Systems that cry wolf lose credibility quickly.
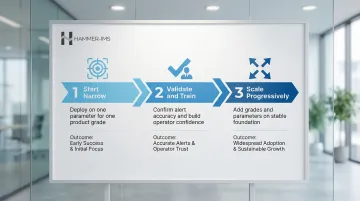
Scalability: Starting Small, Growing Strategically
Each of the challenges above becomes more manageable when implementation is staged rather than attempted all at once. A practical phased approach looks like this:
- Start narrow: Deploy on one critical parameter (thickness, basis weight) for a single well-defined product grade
- Validate and train: Confirm alert accuracy, resolve threshold calibration, and build operator confidence before expanding
- Scale progressively: Add product grades and measurement parameters once the foundation is stable
This sequence lets teams prove ROI early, correct integration issues before they multiply, and avoid the alarm fatigue that derails broader rollouts.
Frequently Asked Questions
What is anomaly detection?
Anomaly detection is the automated identification of data points, events, or measurements that deviate significantly from expected normal behavior. In industrial process monitoring, this typically means detecting out-of-specification product characteristics or abnormal equipment behavior in real time, enabling immediate corrective action.
What are the main types of anomaly detection?
There are three primary types:
- Point anomalies — single isolated deviations, such as a sudden thin spot in film
- Contextual anomalies — deviations that are only abnormal in a specific location or operating context
- Collective/sequential anomalies — groups of readings or trends that signal a problem over time, such as gradual die wear
What are examples of anomaly detection systems?
Common industrial examples include:
- Inline thickness gauges for film extrusion
- GSM measurement systems for nonwovens
- Coating weight scanners for steel strip
- Thermal imaging cameras for temperature monitoring
- Acoustic emission monitors for equipment health
- Vision-based surface inspection systems
Each flags deviations from target values in real time during production.
What is AI anomaly detection?
AI anomaly detection uses machine learning algorithms such as autoencoders, isolation forests, or neural networks that learn the normal pattern of process data and flag observations that don't fit that learned pattern. This approach doesn't require predefined thresholds for every possible defect type, making it valuable for complex, multivariate processes where normal behavior is difficult to characterize statistically.
How does real-time anomaly detection reduce material waste in manufacturing?
Detecting deviations within seconds limits how much defective material is produced before correction occurs. When paired with closed-loop feedback that self-corrects the process automatically, this can reduce waste by 50% or more — compared to manual sampling, which often lets hundreds of meters of off-spec material accumulate before anyone notices.